Since joining Meld Studios as a designer I have helped build and create current and future state maps, road maps and sketches that communicate abstract concepts, processes and interactions. The maps I have worked on help organisations see the ‘50-foot view’ of their organisation: who plays a part in making the wheels turn; and how they interact with each other and the processes and systems that support them. Similar to Google Maps, these maps have the potential to show the street view or satellite view of Sydney, Australia, or the world. At either view they are valuable because they demonstrate connections.
Recently, I was fortunate enough to experience this process purely as a visual communicator. I did not participate in the research sessions so I was coming into this process cold, purely tasked with visualising the journey.
Where I began
We were engaged by an education client to help them understand their current admissions process. Before I started, the team had already boiled down the research into the bones of a story. They’d made connections, but life was yet to be added to the story to make it engaging. I came in to visualise the story the client needed to tell. So where to begin?
Earlier in the year, Janna asked me something that has always stuck “How do you eat an elephant, Dom? Well, you don’t. You eat each toe first then the leg…” It’s difficult to start one of these maps without wanting to sketch out the whole thing. It’s even more difficult starting with the expectation that you need to get it right the first time. So, breaking up the journey into manageable ‘scenes’ and accepting it won’t be perfect the first time is the best place to start.
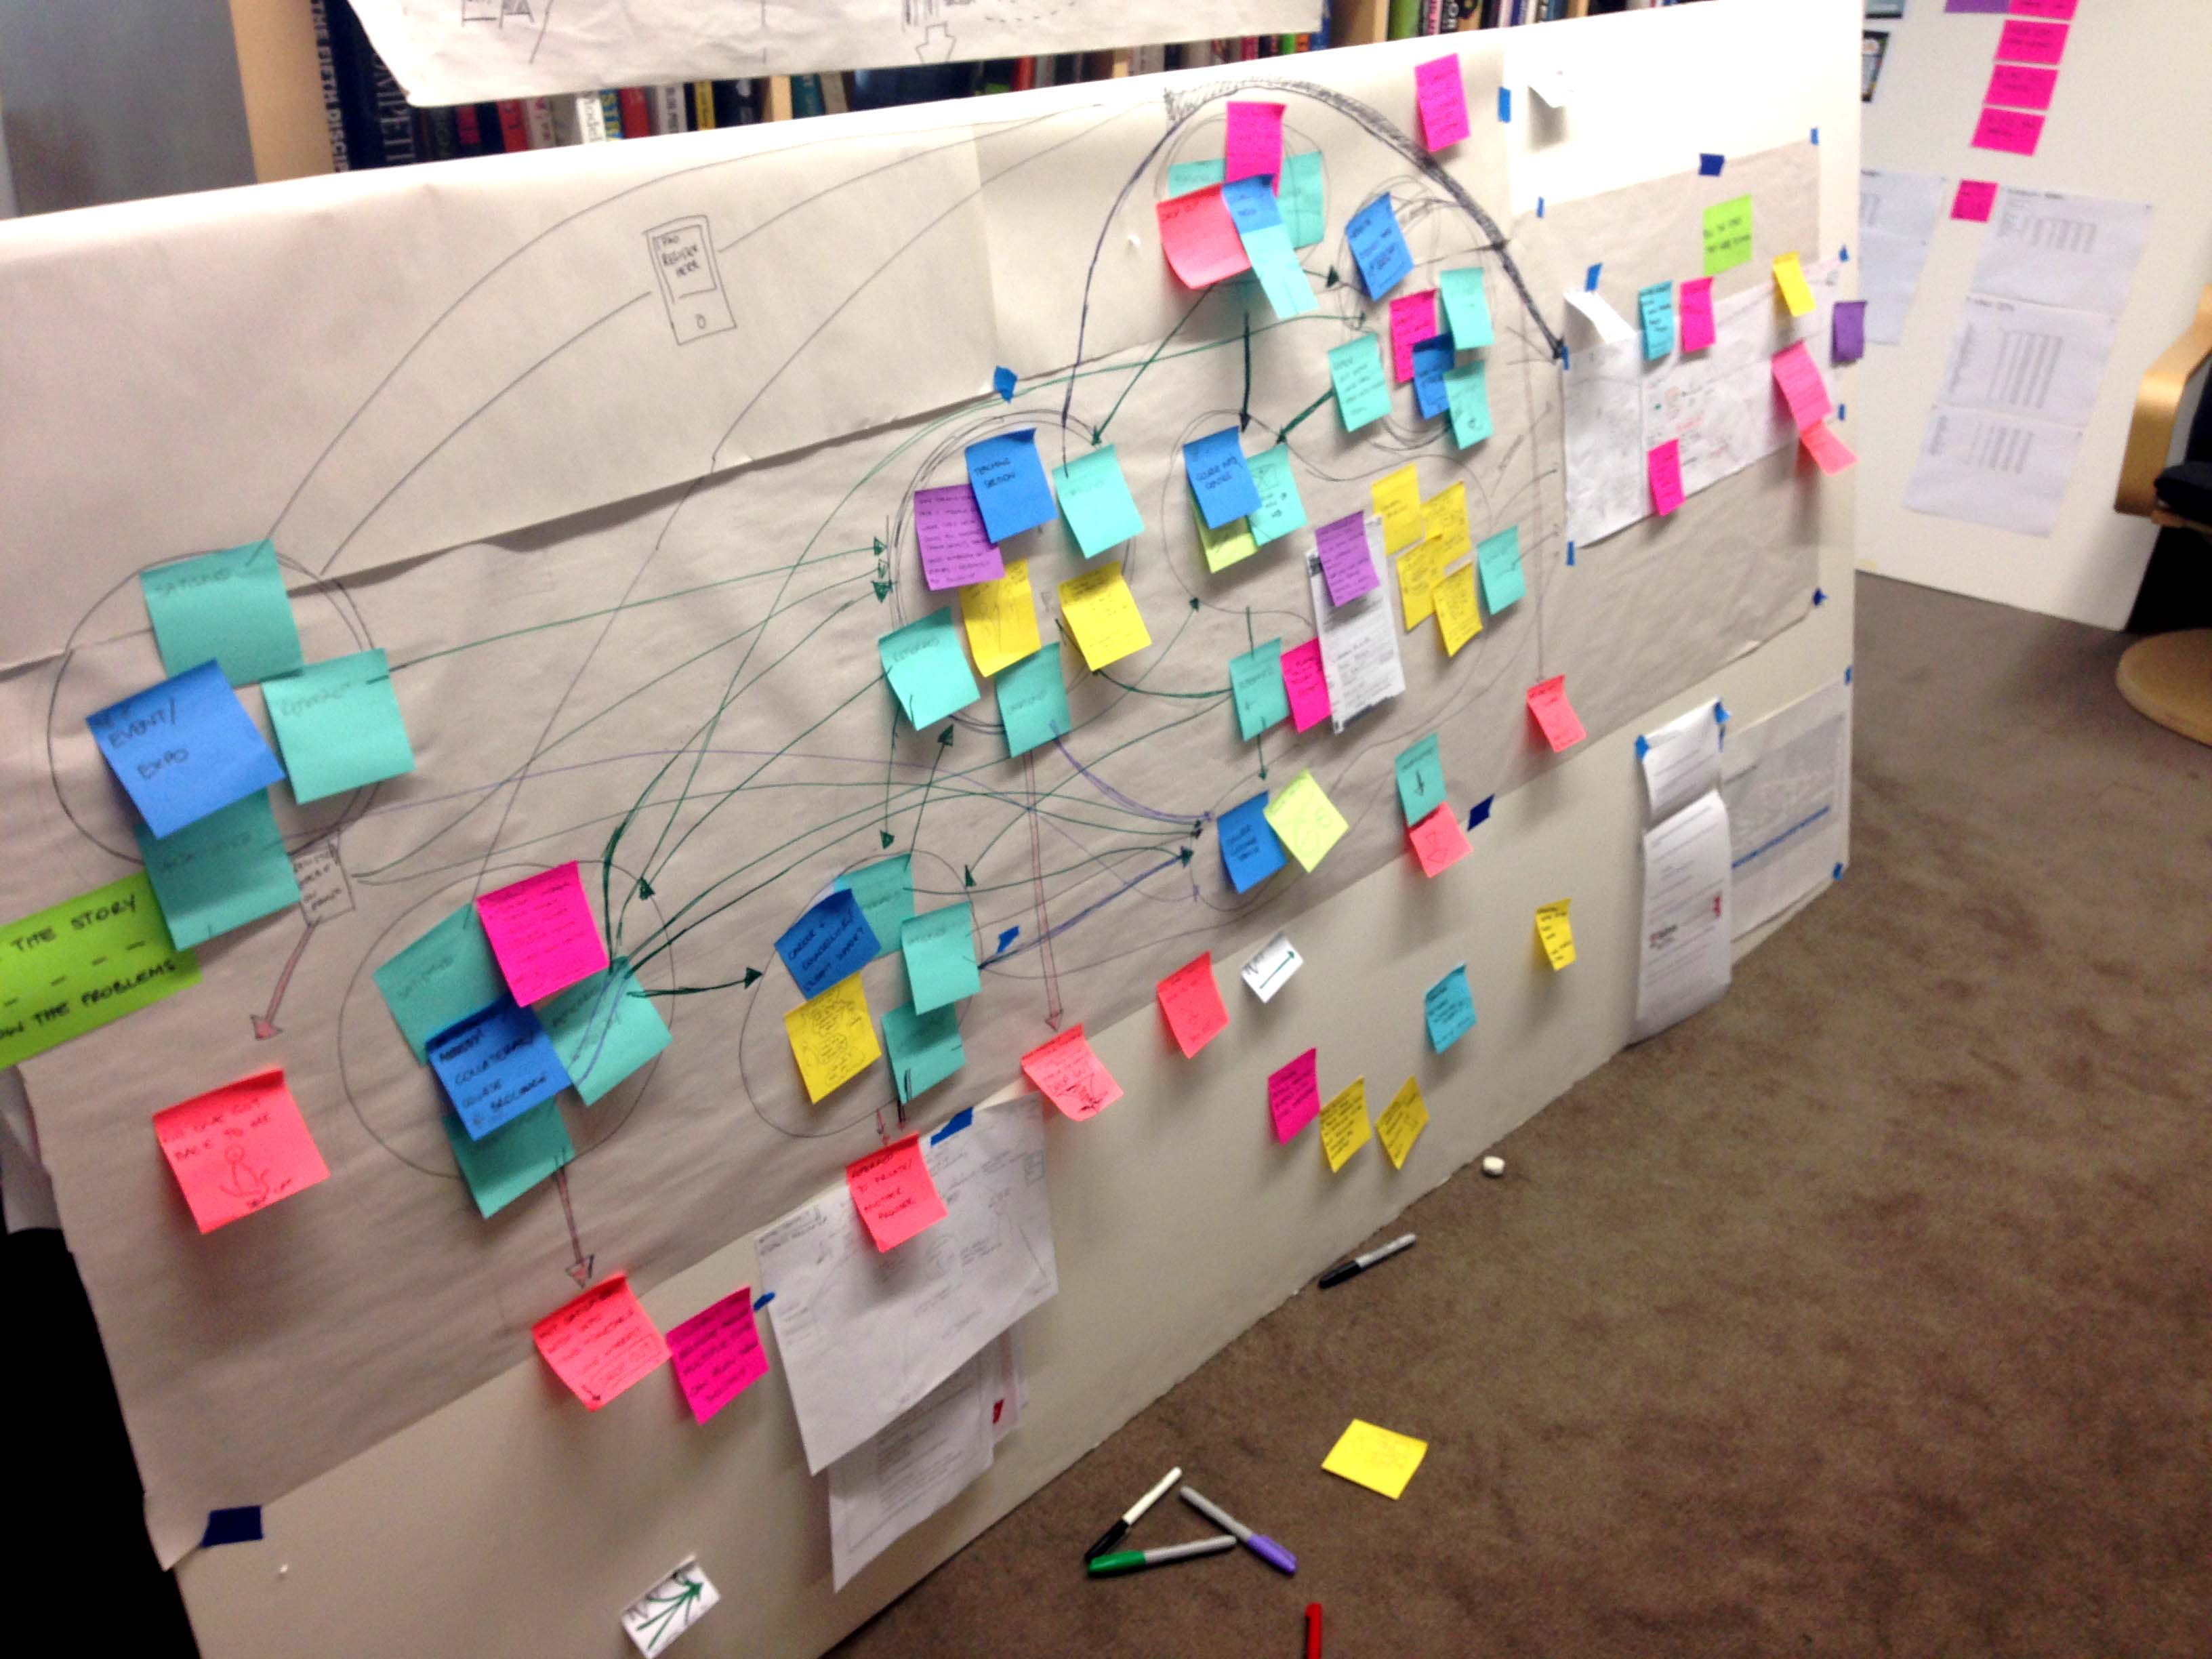
1. Listen, capture and tell the story in a language that makes sense to you
Write and describe the scenes, go straight to sketches, or do both – whatever makes sense for you. I find that describing the scene is more efficient than sketching because I can’t always make the leap to a visual of the scene/concept immediately – and this is ok. Then, retell the story to your storyteller so you know you’re telling the right story.
Things I actively captured/described for myself:
Tips:
2. Reflect on what you captured and visualise the scenes (individually) in a way that comes naturally to you
This step is not stylistic, it’s purely about boiling things down to a more succinct view. Be sure to reference your notes (and the research) – it let’s you dig into the context around the scene and helps in guiding what you need to visualise. But remember, you don’t have to try and capture every single detail in your visualisation. Later on you’ll be able to use captions to flesh out ‘the why’ of the scene.
Tips:
Start creating a library of metaphors for yourself. Even having simple things already drawn like computers, systems, actors etc. makes that translation from words to images less of a leap.
Be playful with your sketches. It makes them more human.
3. Use arrows and lines to make the connections
Don’t try to redraw the scenes. Just make the connections. It helps to use a different coloured marker.
4. Storytelling and visual language
Reflect on what you have just mapped out. This step is about making the map easier to understand and read.
Make rules for yourself. Think about:
Whose story are you telling? Every story is told from someone’s point of view (the narrator, the hero, the victim…). Make sure you are consistently telling the story from the right perspective so that your story makes sense from start to finish.
Which characters support the hero? While their role is significant to the flow of the story, their story isn’t present in every scene. How can that be represented visually?
How will the main path be distinct from forks in the road? Shouting many stories at the same time distracts from, or even buries, the ‘hero’ of the story.
What needs to be in the scene to communicate the story? What is in the scene that doesn’t add to the story? Be ruthless with editing.
Tips:
Think of the scenes as a canvas that can be used to tell the hero’s story: their frustrations; how they feel when they can’t overcome an obstacle; what they feel when they are in a new situation... These insights brings the story to life and makes the reader more willing to engage.
Use captions to narrate the story and add depth and perspective.
What does each arrow mean? Can arrows be treated differently to tell the story in a clearer way.
How big is one scene compared to another? Use scale to give emphasis to the main journey and the key actors.
5. Refine, iterate, cut, paste and redraw!
When you get to a stage where all the elements of the story are there and connected, try re-creating the story from end-to-end with the new hierarchies and visual language. Untangle things and map out the story so you can see it clearly.
Hopefully what you end up with (or begin the next phase with) is a clearer view of the story then what you started with, and a means to socialise your story with others in a more engaging way.
The client’s story: how they turned the research into a story
The client had never done anything like this before and didn’t understand the direction they needed to take. Working everyday in the organisation everyday made it challenging for them be objective and to remember that not every detail had to be told. The process was overwhelming and confusing at times, but here are five guiding things that helped the client through this process.
1. What is the purpose of this story?
They told the story of the research – what they heard. They had to separate what they know of the end-to-end process and tell the story that was painted by the research.
2. Tell the story that needs to be known and highlight the problem areas
The client realised that they couldn't get caught up in teasing out all the details of the process, otherwise the story their audience needed to be told would get lost. The client (who was working in our office) had this rule pinned up near their workspace so they always remained focused.
3. Acknowledge the process is confusing, and accept it
There were many moments where the end point was ambiguous. This was at times an obstacle to progress. Acknowledging the process is confusing let them move forward with the process and be confident that there’s no ‘right way’ to be doing this.
4. Start with headings, titles and captions to help boil things down
Doing this helped the client better connect and understand the flow of the map. They were able to see the overall shape of the map as connected phases that impacted on, or flowed into each other, rather than becoming lost in the granular details and processes.
5. Find inspiration and see the possibilities
They needed existing examples of journey maps to inspire and imagine the potential of their own story.