As consultants we have to quickly understand the complex interactions of people, processes and products of our clients' businesses. This '50 foot view' is something that our clients often say they've never seen before yet is of real value for sharing project and system knowledge with the wider team.
Concept mapping is something I was introduced to in Jon Kolko's workshop at UX Australia in 2011. You can read about the process in Kolko's book Exposing the Magic of Design. There are also some great examples on the Dubberly site including this one describing the process of a heart attack.
Why concept mapping?
In our recent job, concept mapping helped us to rapidly understand all of the players and interdependencies of the problems we identified during research. Rather than just concentrating on one business unit as though it has no influence on others, the final concept map allows us to refer to how the problem affects and is affected by all players within the system.
The process of creating the map was quite interesting and it was very important to trust in the process (it got messy!). Having our clients in the room to do this activity with us was invaluable. If we did it again I would make sure there were representatives from all business units so as not to make too great an assumption about their area.
How was it used?
We used the map to guide our concept generation by attaching "How might we..." statements to each problem area. It was good to have the map up on the wall as it made the previously intangible organisational structure more concrete. For me this showed the value of the activity as the knowledge no longer existed solely in our client's heads. People could point to a physical place where an idea or problem 'resided' and then we could all see how it linked to and impacted upon other areas.
How did we do it?
The following is a brief description of the steps we followed.
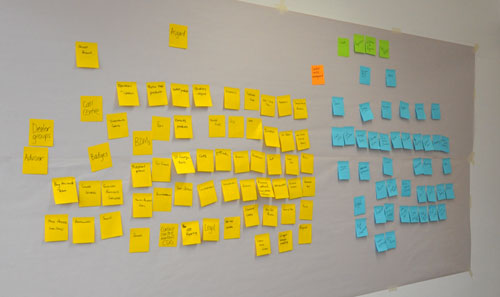
(a) LIST
Start by listing out the tangible artefacts and major players that exist in the delivery of the service e.g. Call Centre, Products, Operations, Client. We wrote each onto sticky notes, using a different colour to signify different brands within the business.
(b) RANK
Organise and rank them from high-level through to the more tactical components of service delivery (call centre/communications/etc). Place the high-level components at the top of the wall and the tactical ones below them. Arrange and then rearrange until the basic system is mapped out. This may take some time but don't give up. If you could only see my face in these photos I am sure you would think I was about to faint with horror but it did get better!
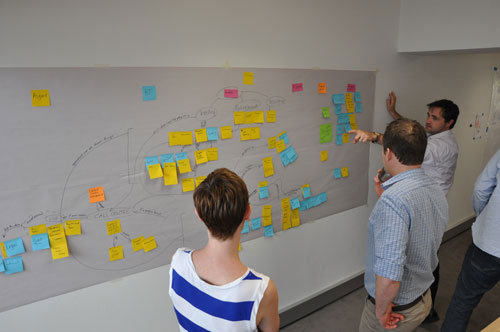
(c) LINK
Use a pen to draw links from one player to each related item and label each link with an action statement. eg. SALES STAFF provide product advice to their CLIENTS. Your client will be your friend here as they will have the greatest knowledge of internal process.
(d) HIGHLIGHT PROBLEM AREAS
Highlight problem areas (we used red sticky dots). The problems were those that we repeatedly heard during our customer research and those that the client had found during their internal research.
(e) FINESSE
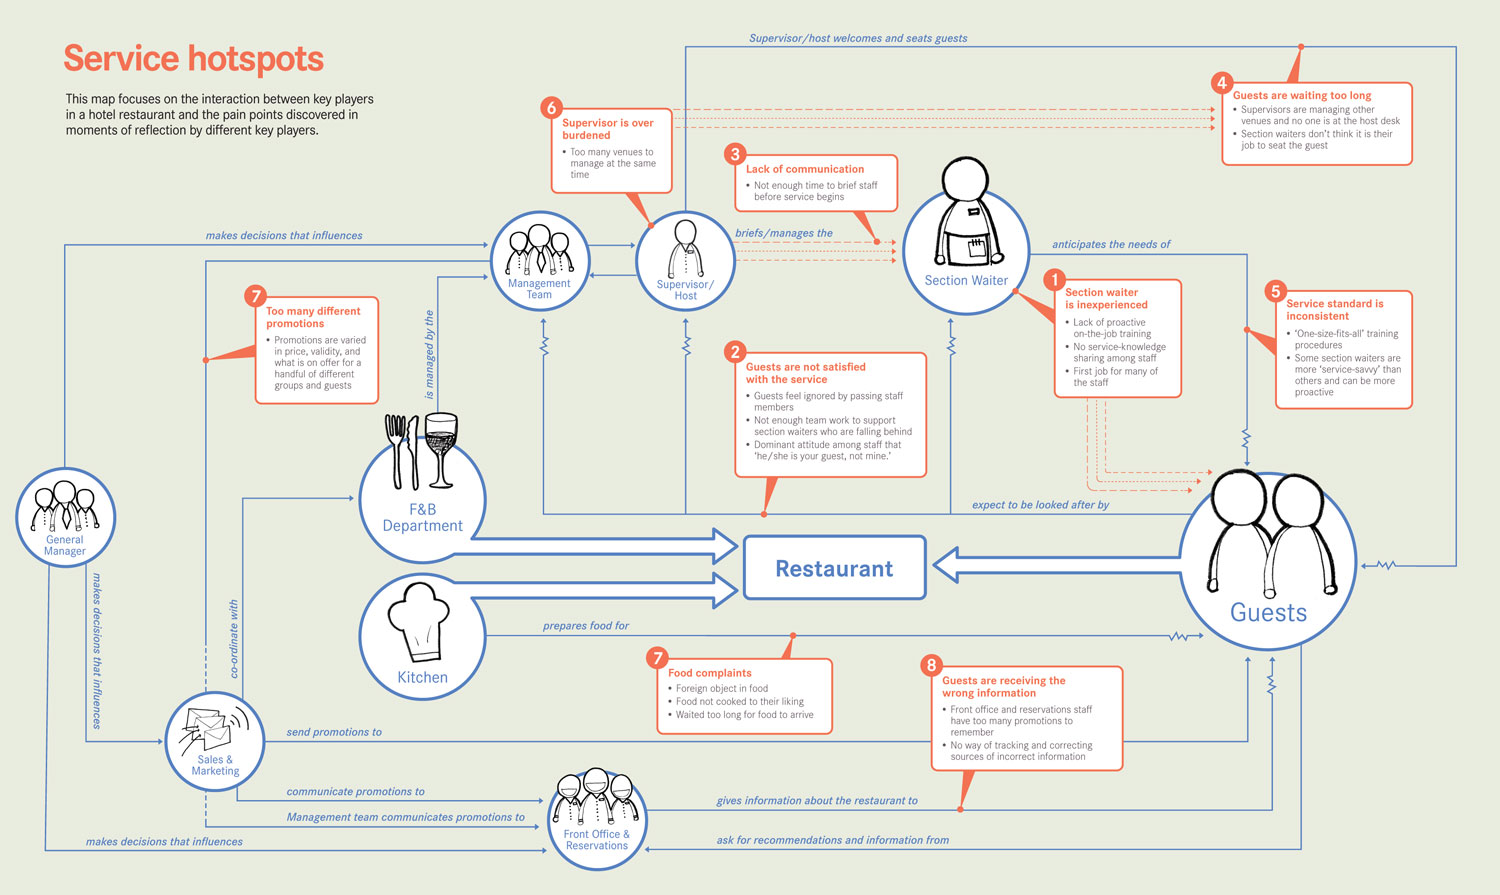
Redraw map whilst the client is in the room so that you don't forget what has happened or miss anything important. We did this first on sticky notes, then on the computer and printed it out before the client left for the day.
The map shown is not the final deliverable but rather a generic version. This should give a reasonable idea of the finished map (sorry we can't show the real one!).
If you'd like talk to us about concept mapping of your organisation, please get in touch.